Most pre-match analysis begins and ends with a win-draw-loss record. That tells you very little. What actually matters is understanding how a team wins, how they lose, when goals tend to arrive, and how their attacking output compares to their efficiency. Goal Guru's Past Matches section is built to surface exactly this kind of information, organised so you can read it quickly before a match kicks off.
Head-to-Head Comparison
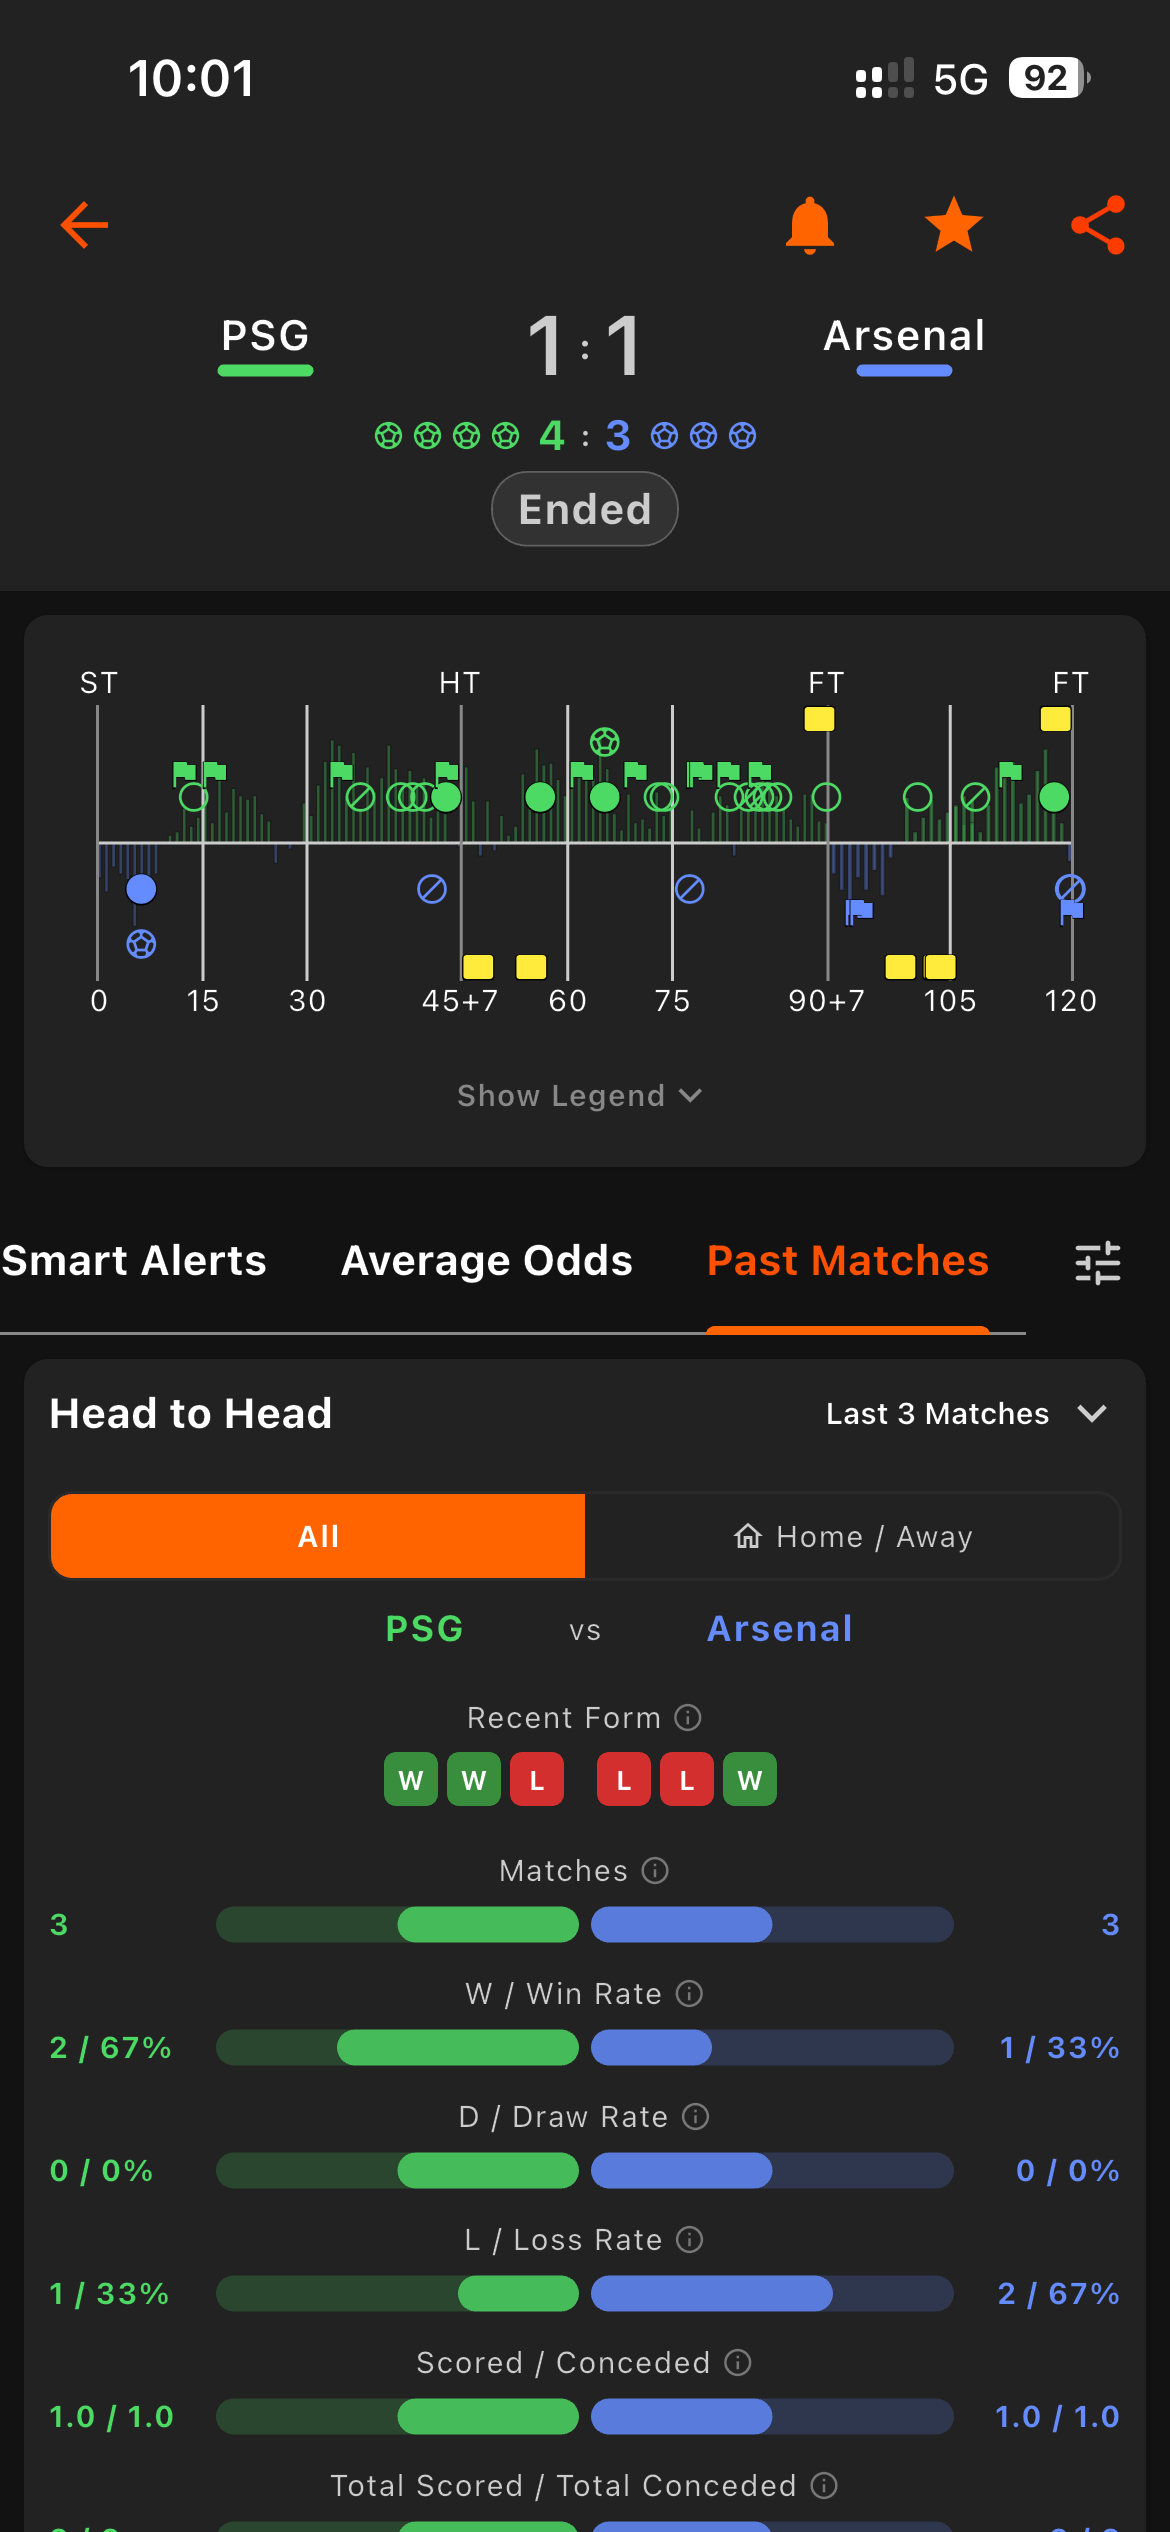
Head-to-head comparison view showing win rates, scored/conceded averages, BTTS, and shot metrics side by side.
The H2H comparison view places both teams side by side across every major metric: win rate, draw rate, loss rate, average goals scored and conceded, clean sheet percentage, over-goal percentages, shot attempts, shot accuracy, and conversion rate. The bar chart format makes it immediately clear which side holds the advantage in each category rather than requiring you to interpret raw numbers in isolation.
Filtering by Home / Away context is one of the most useful adjustments you can make here. A team's overall record often flattens meaningful differences — a side that wins 70% of home matches but struggles away will look average across all games combined. Switching the filter reveals the underlying split and gives you a more accurate read on what to expect from a specific fixture.
Goal Distribution and Comeback Rate
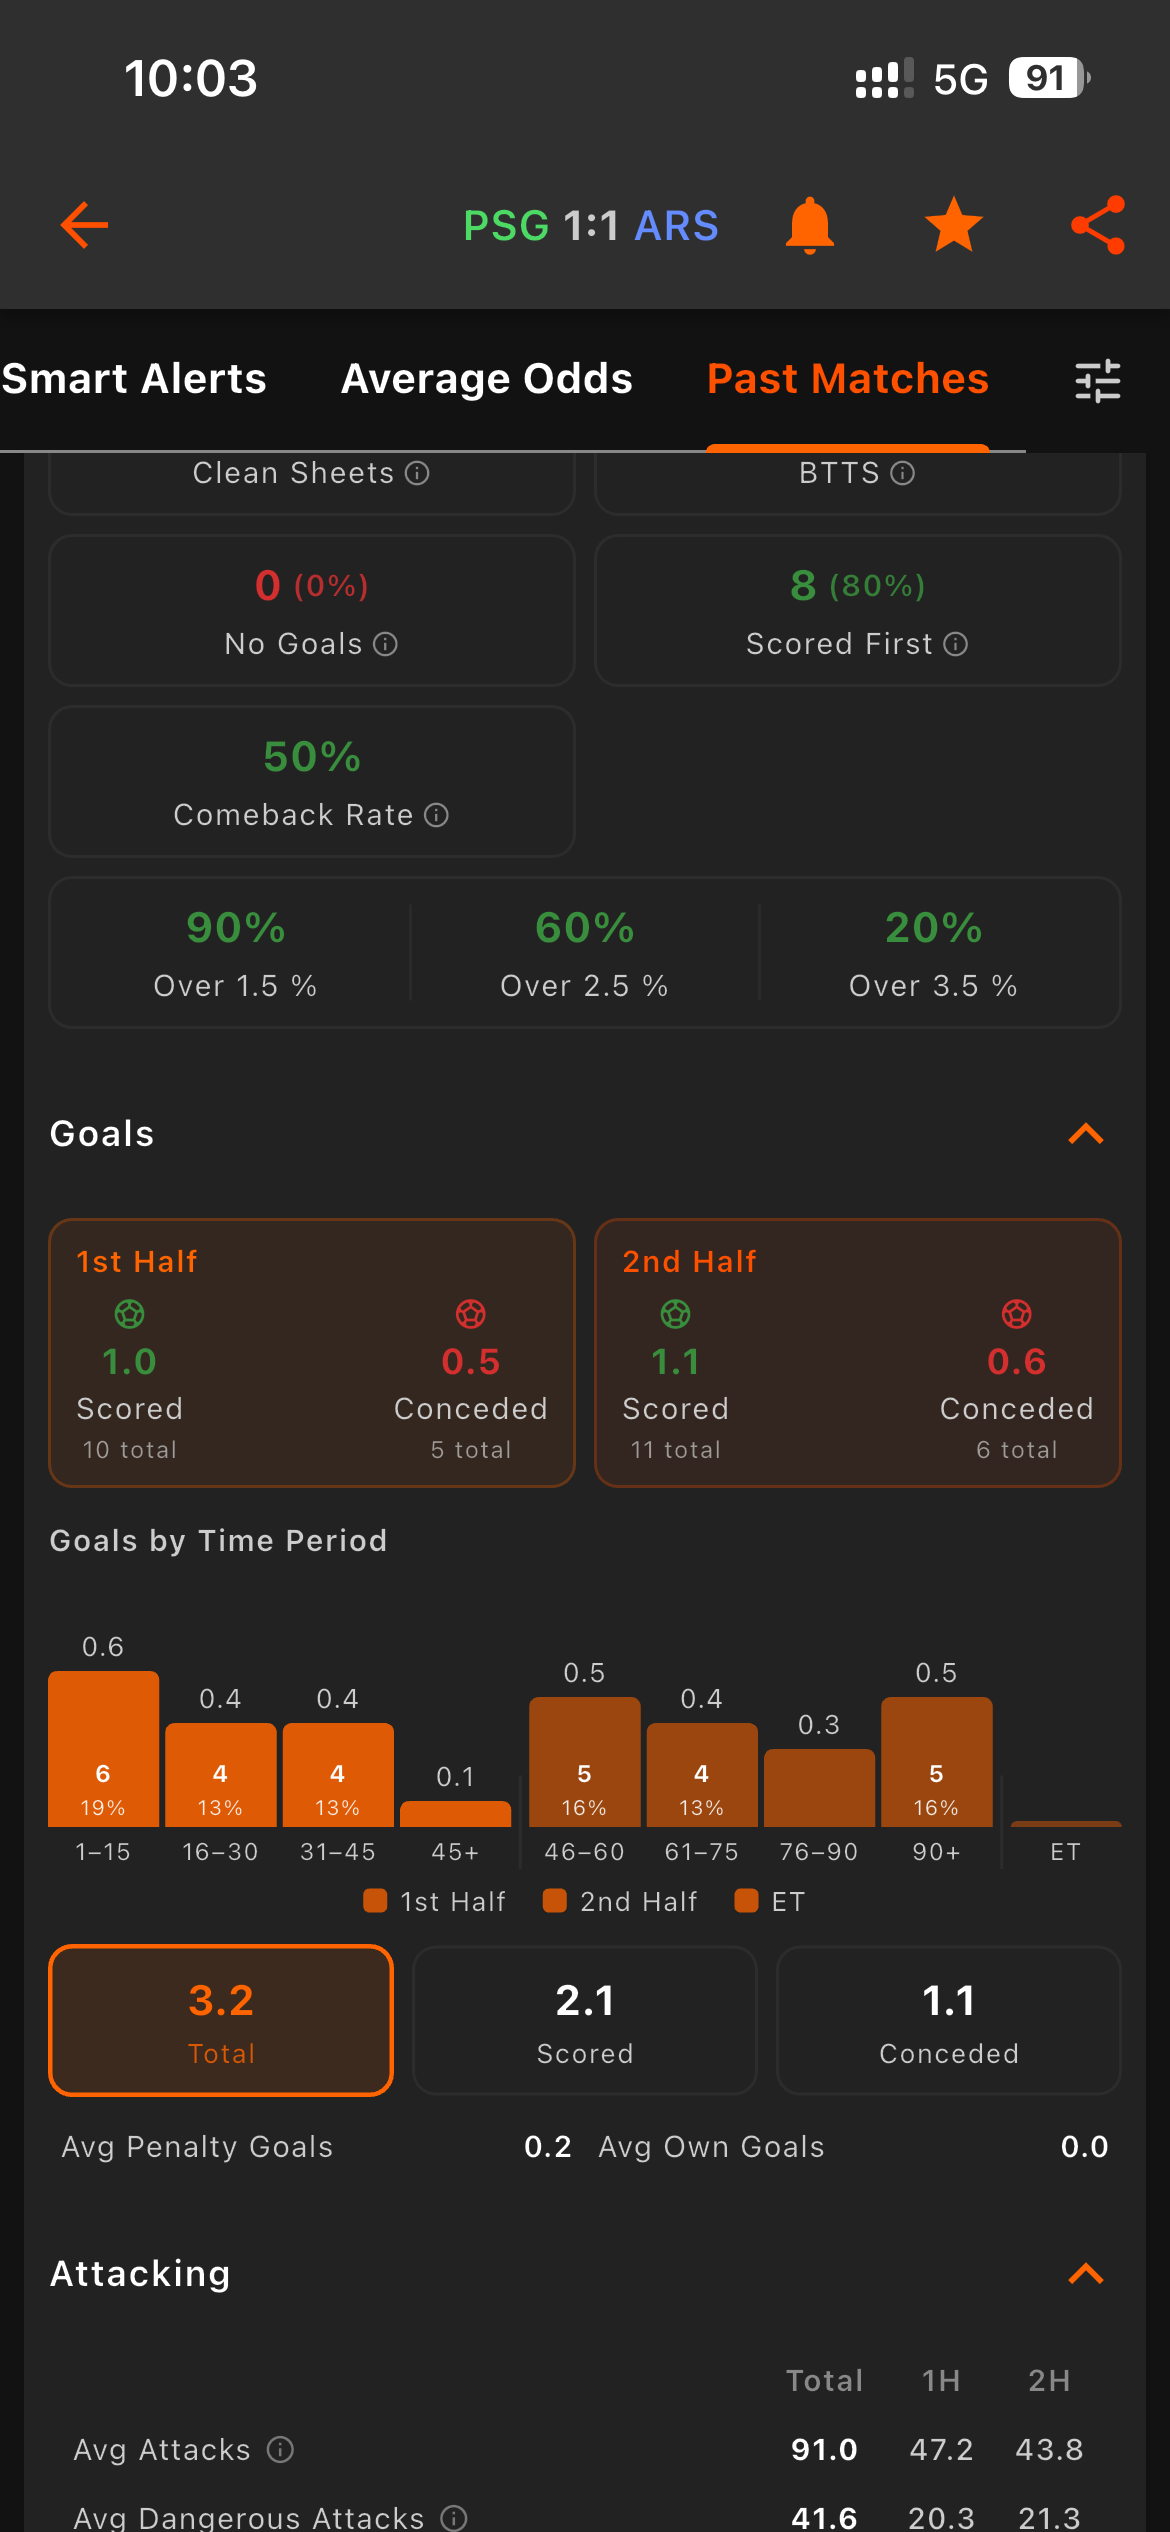
Goal distribution by 15-minute period, comeback rate, and BTTS/clean sheet summary cards.
The Goals section breaks scoring down into 15-minute windows across the full 90 minutes, separated by first and second half. This distribution is more informative than an average goals-per-game figure because it reveals when pressure tends to convert into goals. A team that scores heavily in the 46–60 minute window is often one that adjusts tactically at half-time or benefits from opponents tiring early in the second period. A team that concedes frequently in the 76–90 window may struggle to hold leads under late pressure.
Comeback Rate is a metric that often goes unexamined but carries real analytical weight. A team with a 0% comeback rate across their recent matches — meaning they have never recovered from a losing position — is a very different proposition from one that regularly overturns deficits. When combined with the Scored First percentage, you can judge how important the opening goal is likely to be: if a team wins 90% of matches when they score first but has a 0% comeback rate, the match dynamic shifts entirely the moment either side takes the lead.
The summary cards — Clean Sheets, BTTS, No Goals, Scored First, and the Over 1.5 / 2.5 / 3.5 percentages — give you a quick-read layer on top of the distribution data. In the example shown, both teams to score in 100% of recent H2H meetings and Over 2.5 goals in 100% of those fixtures is a strong signal about the likely nature of this match.
Attacking Averages and Shot Efficiency
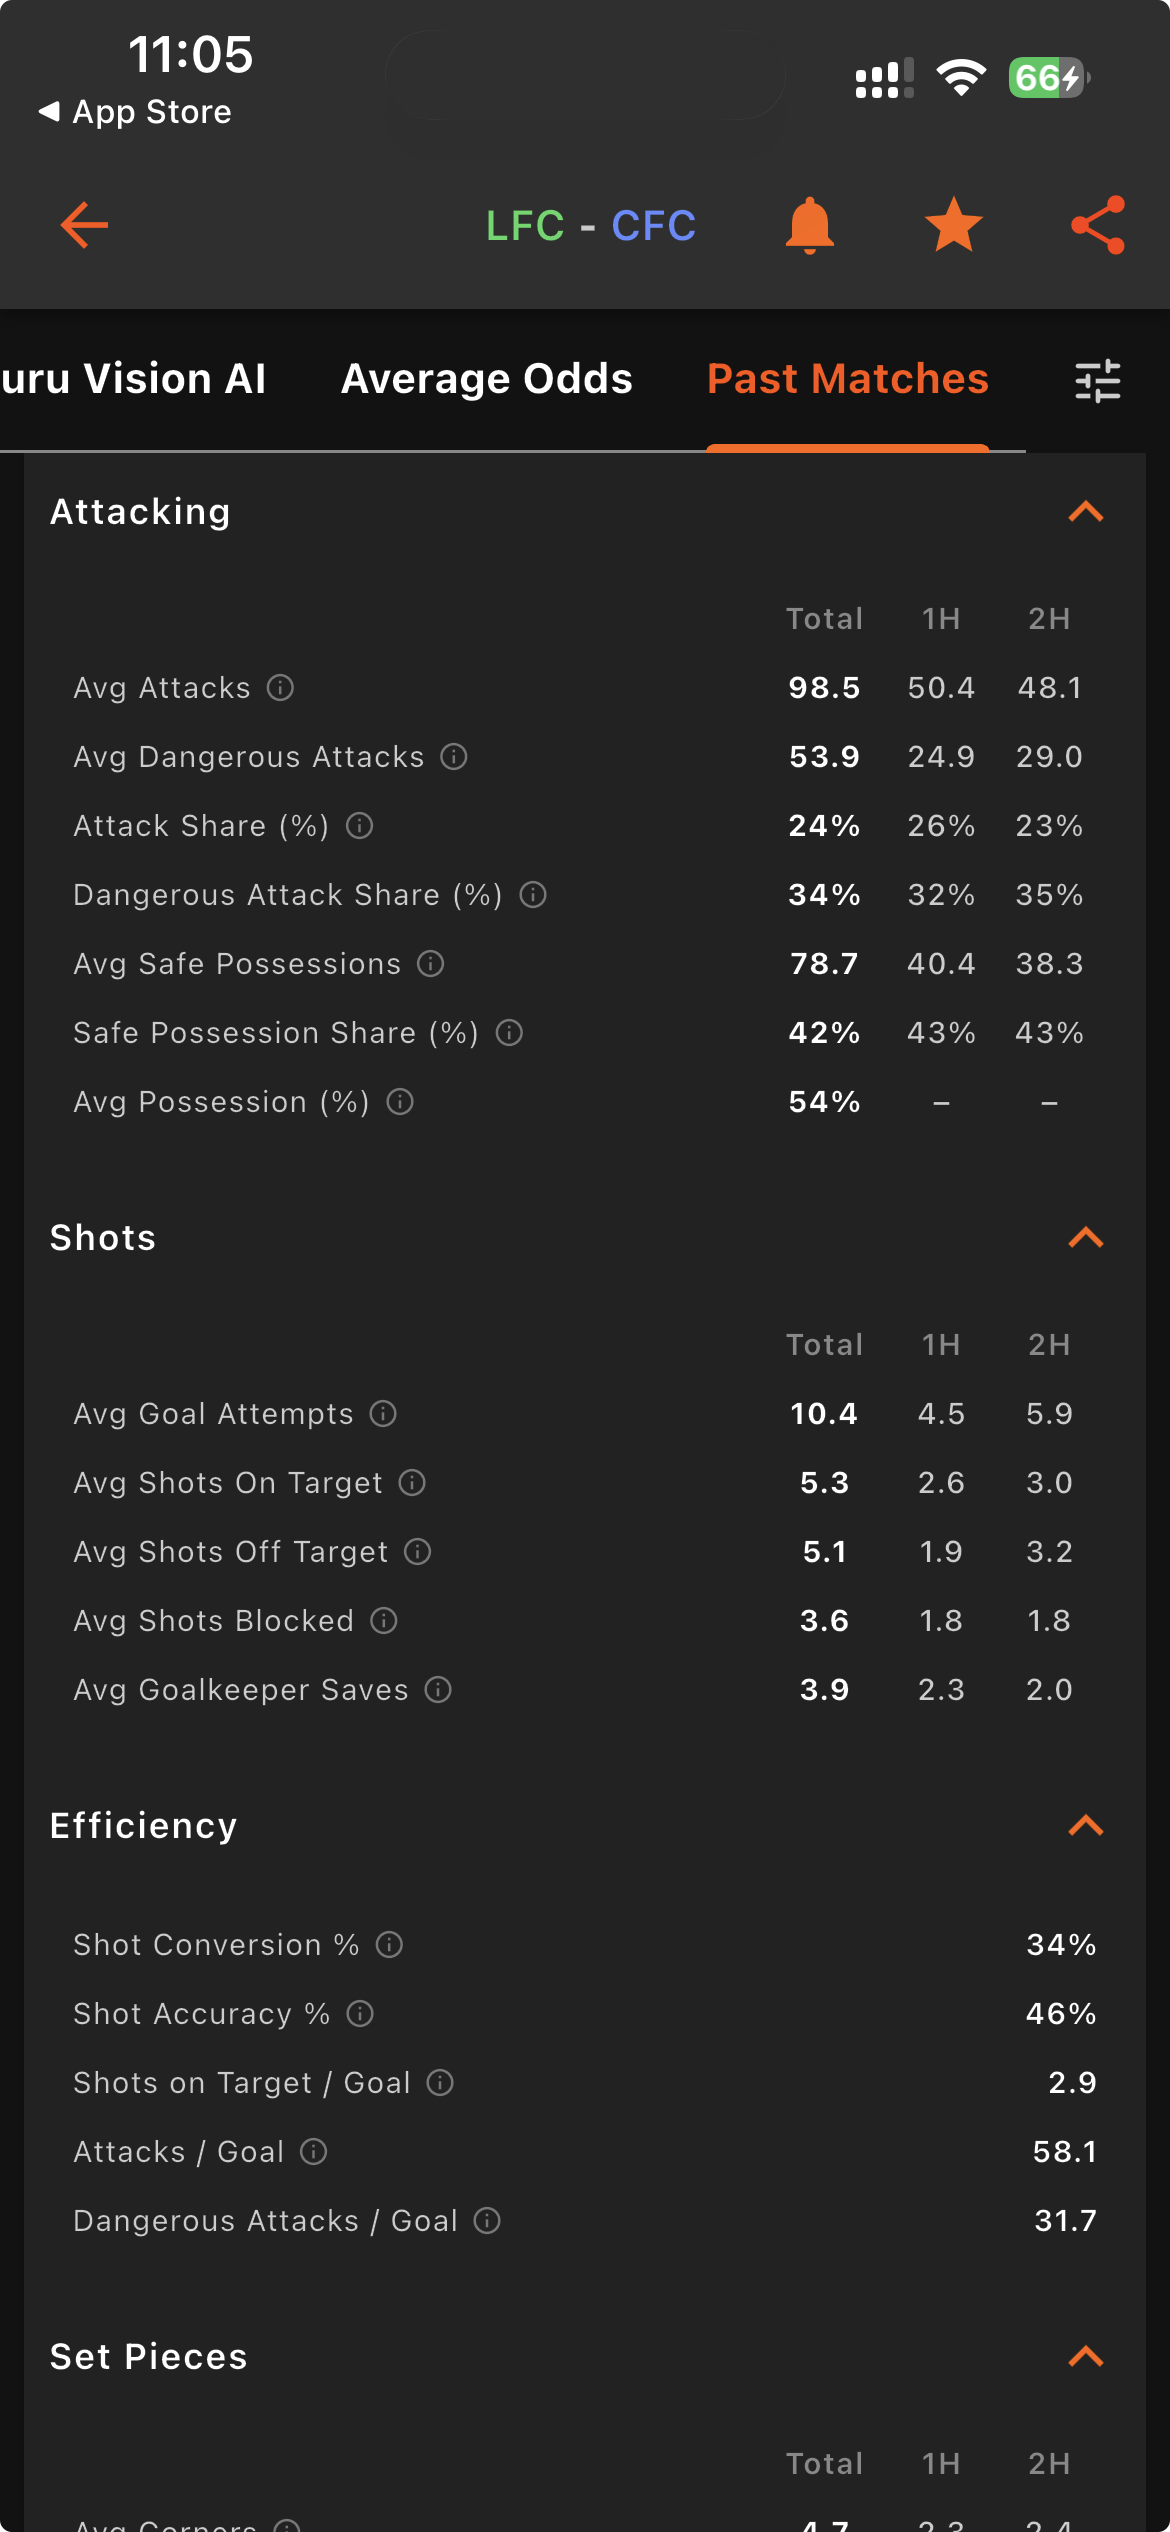
Attacking, shots, and efficiency sections showing total, first-half, and second-half averages.
The Attacking section shows average attacks, dangerous attacks, and possession figures split across the full match, the first half, and the second half independently. This split is valuable because many teams show distinctly different attacking patterns between halves — either pressing harder early or shifting to a more aggressive second-half approach. A team averaging 29 dangerous attacks in the second half compared to 24.9 in the first is demonstrably more threatening after the break, which is worth factoring into any analysis of when key moments are likely to arrive.
The Efficiency section is where you can assess the quality behind the volume. Shot Conversion % tells you how often a team turns goal attempts into goals. Shot Accuracy % measures what proportion of shots are on target. Shots on Target per Goal shows how many on-target efforts are needed on average to score. A team generating 10 shots per game but converting only 6% of them is a different attacking threat from one generating 6 shots with a 34% conversion rate — the raw shot count alone would mislead you.
Putting It Together
The most practical way to use this data is to build a picture of the match before it starts, then use Smart Alerts to monitor whether those patterns are emerging live. If the H2H data shows both teams consistently score after the 60-minute mark and the attacking averages point to a slow first half, you can set a Smart Alert that monitors shot volume and dangerous attack accumulation in the second half rather than watching the scoreline passively. The Past Matches section doesn't tell you what will happen — it tells you what tends to happen, and that distinction is what separates reactive watching from informed analysis.