Most Smart Alert users set their conditions, activate the alert, and then wait to see if it performs. That approach works, but it can take weeks of live data before you know whether an alert is genuinely selective or just firing at random. Backtesting compresses that validation into a few minutes by running your alert against historical match data and returning a structured report on how it would have behaved.
Setting Up a Backtest
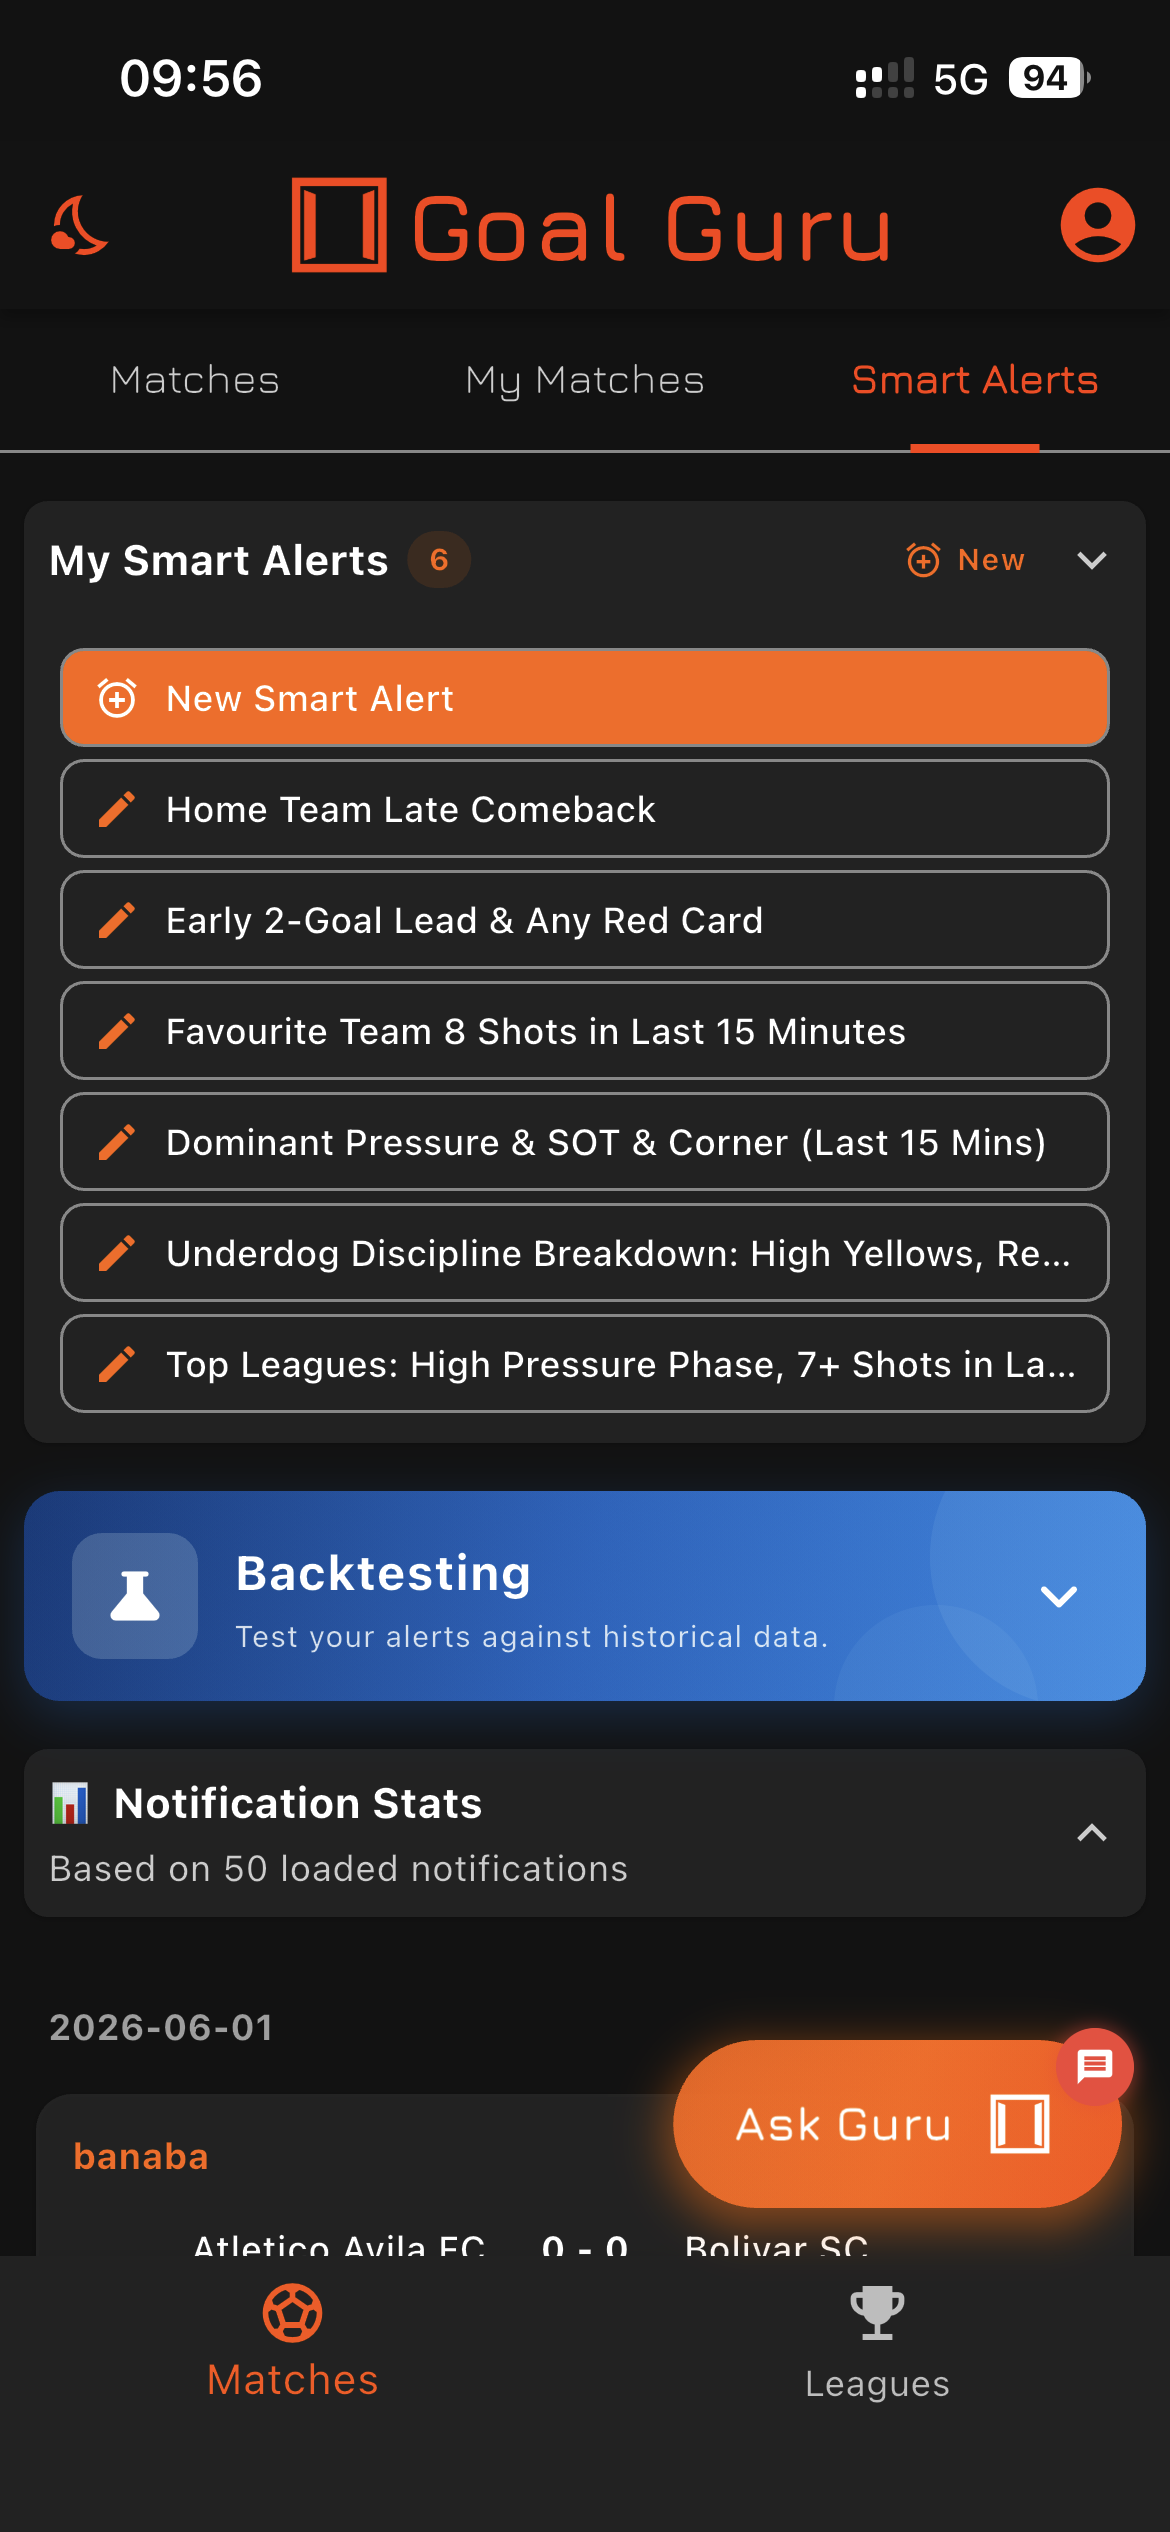
The Backtesting section sits below your active alerts in the Smart Alerts tab. Tap to expand the panel and select an alert to test.
Backtesting is accessible from the Smart Alerts tab. The Backtesting section sits below your active alerts. Tap it to expand the panel. From there, select the alert you want to test and choose a time range: 7, 14, 30, 60, or 90 days. Each day costs one credit, and your weekly allowance resets every Monday. The credit balance bar in the panel shows your current position before you commit.
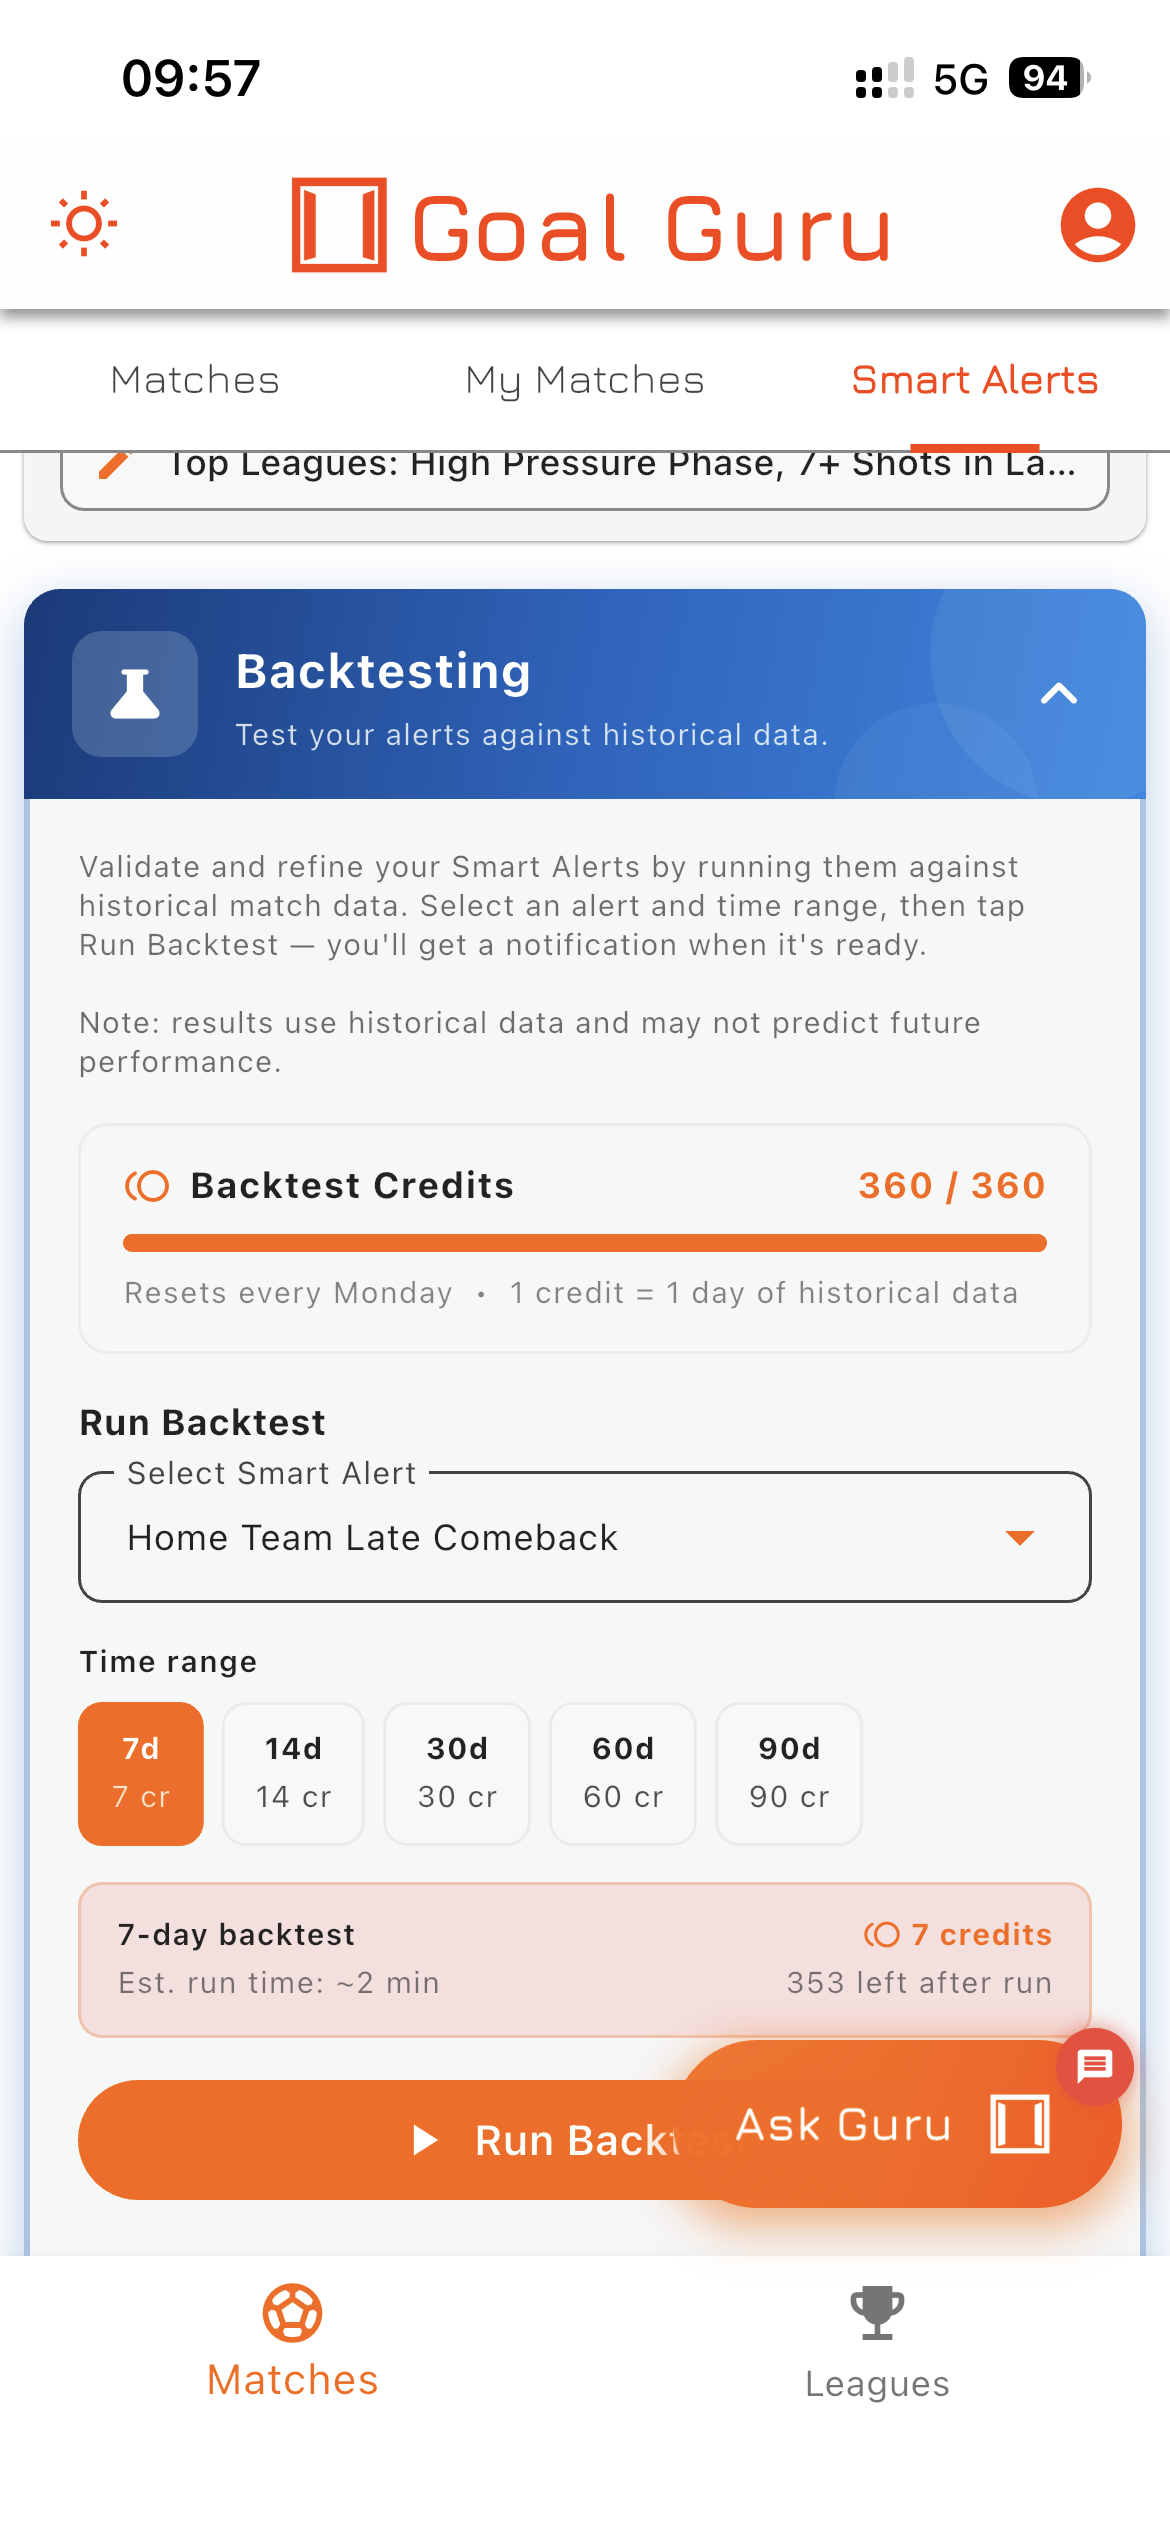
Select your alert, choose a time range, and check the credit cost before running. The 7-day window costs 7 credits and typically completes in under two minutes.
The practical approach is to start narrow. A 7 or 14-day run tells you quickly whether an alert is triggering at all and roughly how often. If it fires a reasonable number of times in that window, a 30 or 90-day run gives you the statistical sample you need to draw meaningful conclusions. Running 90 days immediately on an untested alert can spend credits on a report with three data points in it.
Once you tap Run Backtest, the job processes server-side. You'll receive a notification when the report is ready, typically within a couple of minutes. The results are stored and accessible anytime from the Recent Backtests panel.
The Trigger Picture
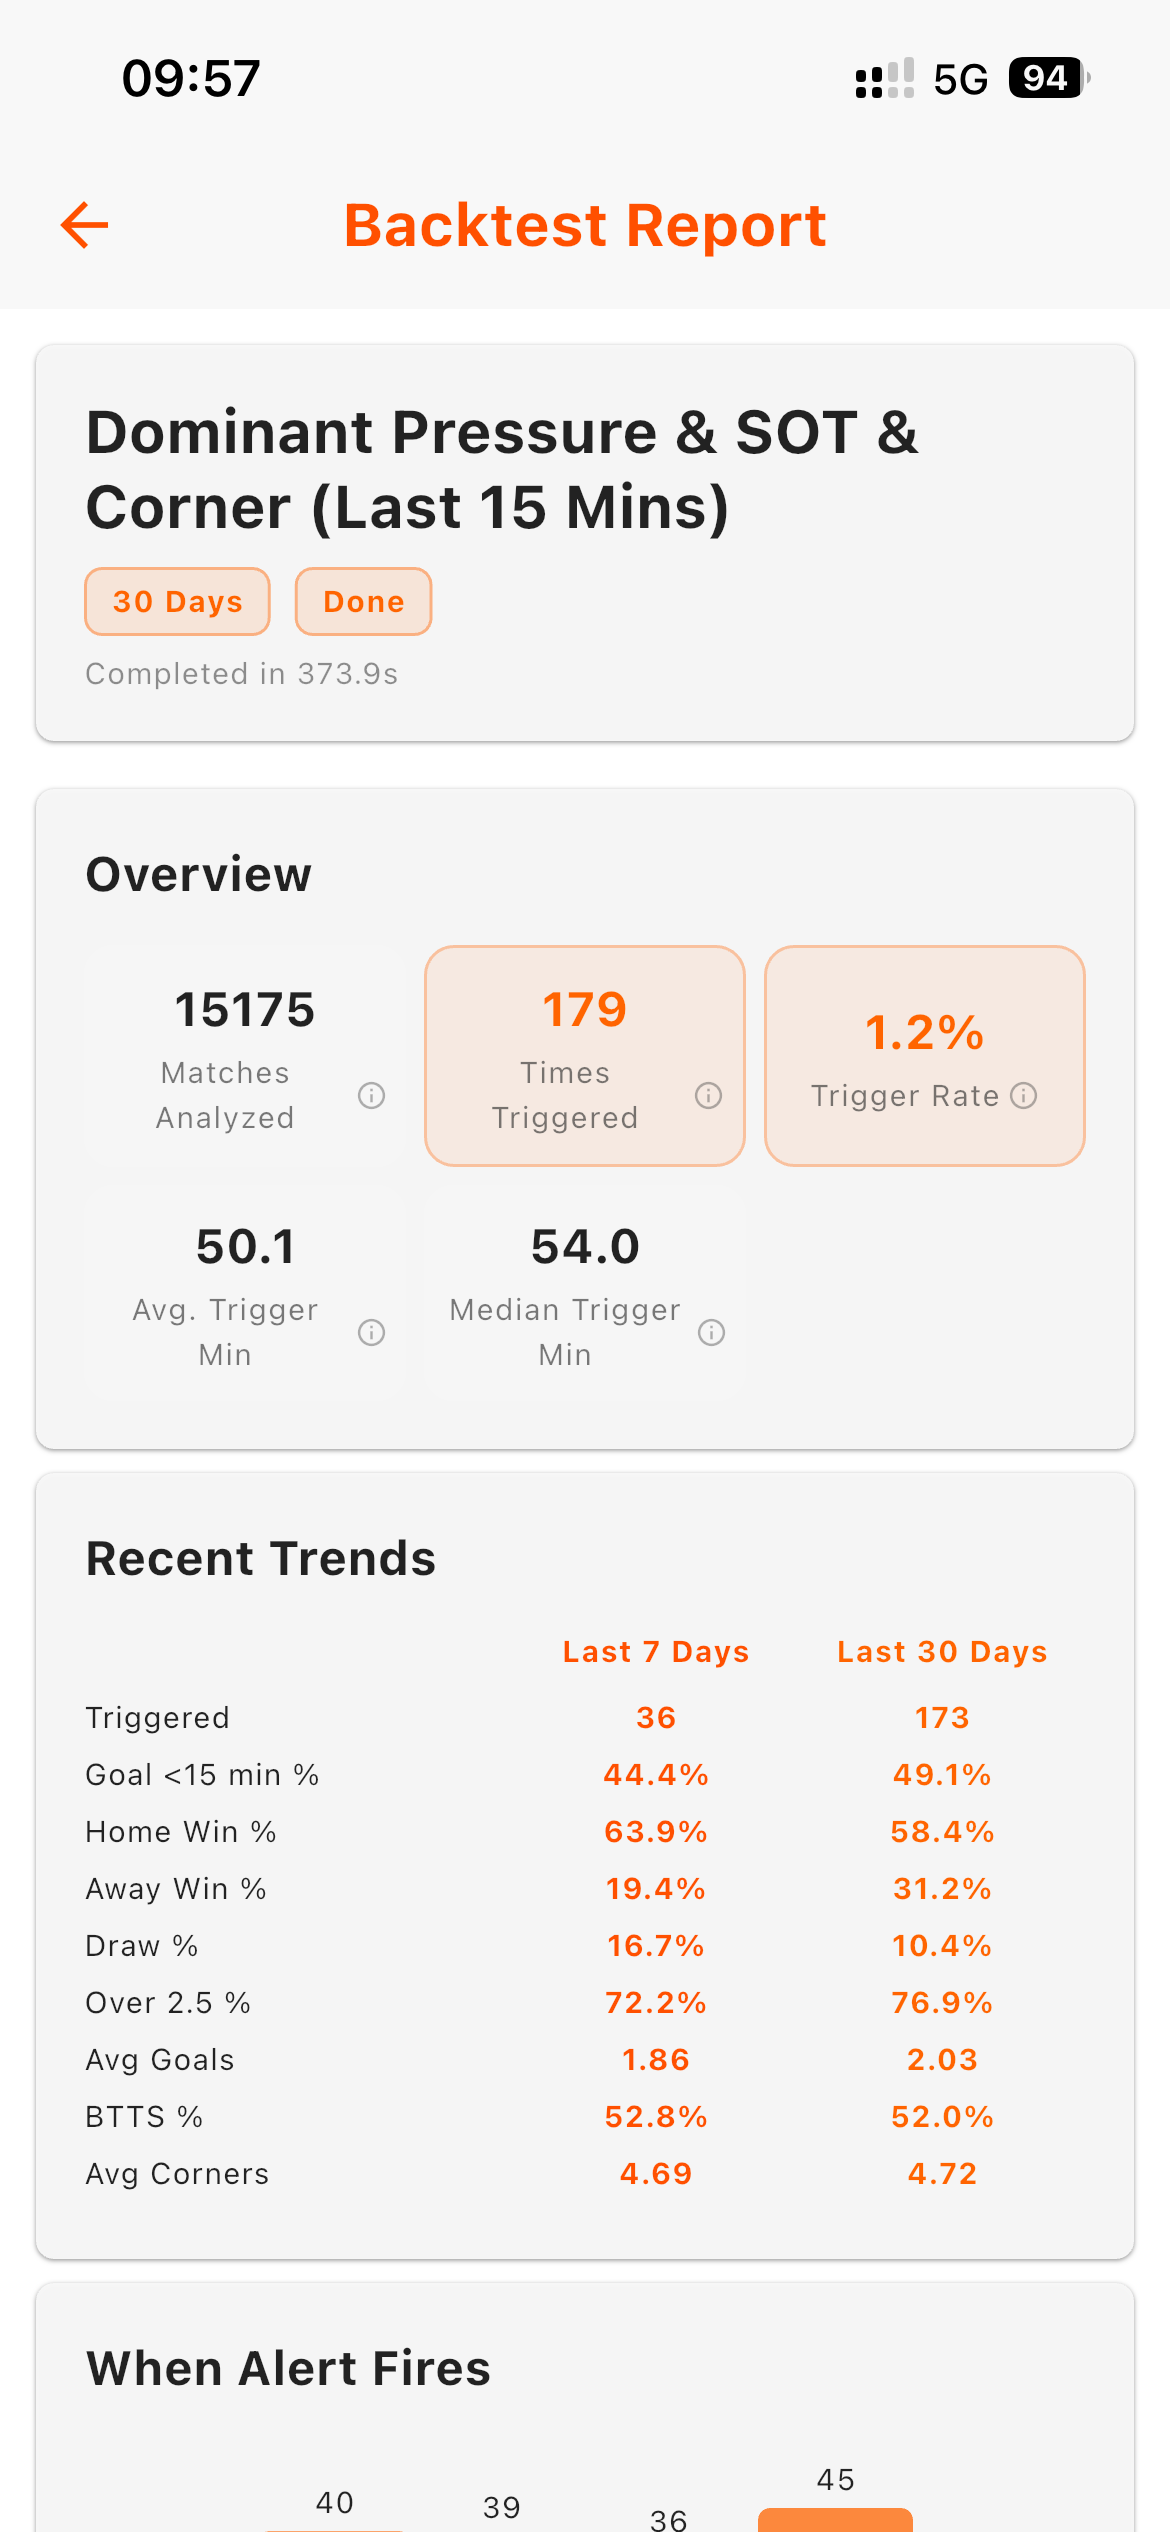
The overview section shows total matches scanned, times triggered, trigger rate, and average trigger minute. Recent Trends compares the last 7 days against the full run period.
The first thing a backtest report tells you is when and how often your alert fires. The overview section shows total matches scanned, times triggered, and trigger rate as a percentage. A 1.2% trigger rate across 15,000 matches means your alert fired 179 times, selective enough to be meaningful and frequent enough to build reliable statistics from.
The trigger minute distribution breaks this down further, showing which 15-minute intervals see the most activity across 0–15, 16–30, 31–45, 46–60, 61–75, and 76–90. An alert that fires predominantly in the 61–75 window tells you something specific about the match situations it's identifying: late second-half pressure, chasing teams pushing forward, tiring defensive lines. This timing context matters when you're watching a live match and deciding how much weight to give an alert.
Score at Trigger tells you the scoreline context when your alert fires: how often the home side is leading, how often it's level, how often the away side is ahead. An alert that fires almost exclusively when one side is already winning two goals is a different proposition from one that consistently fires in level games.
What Happened After
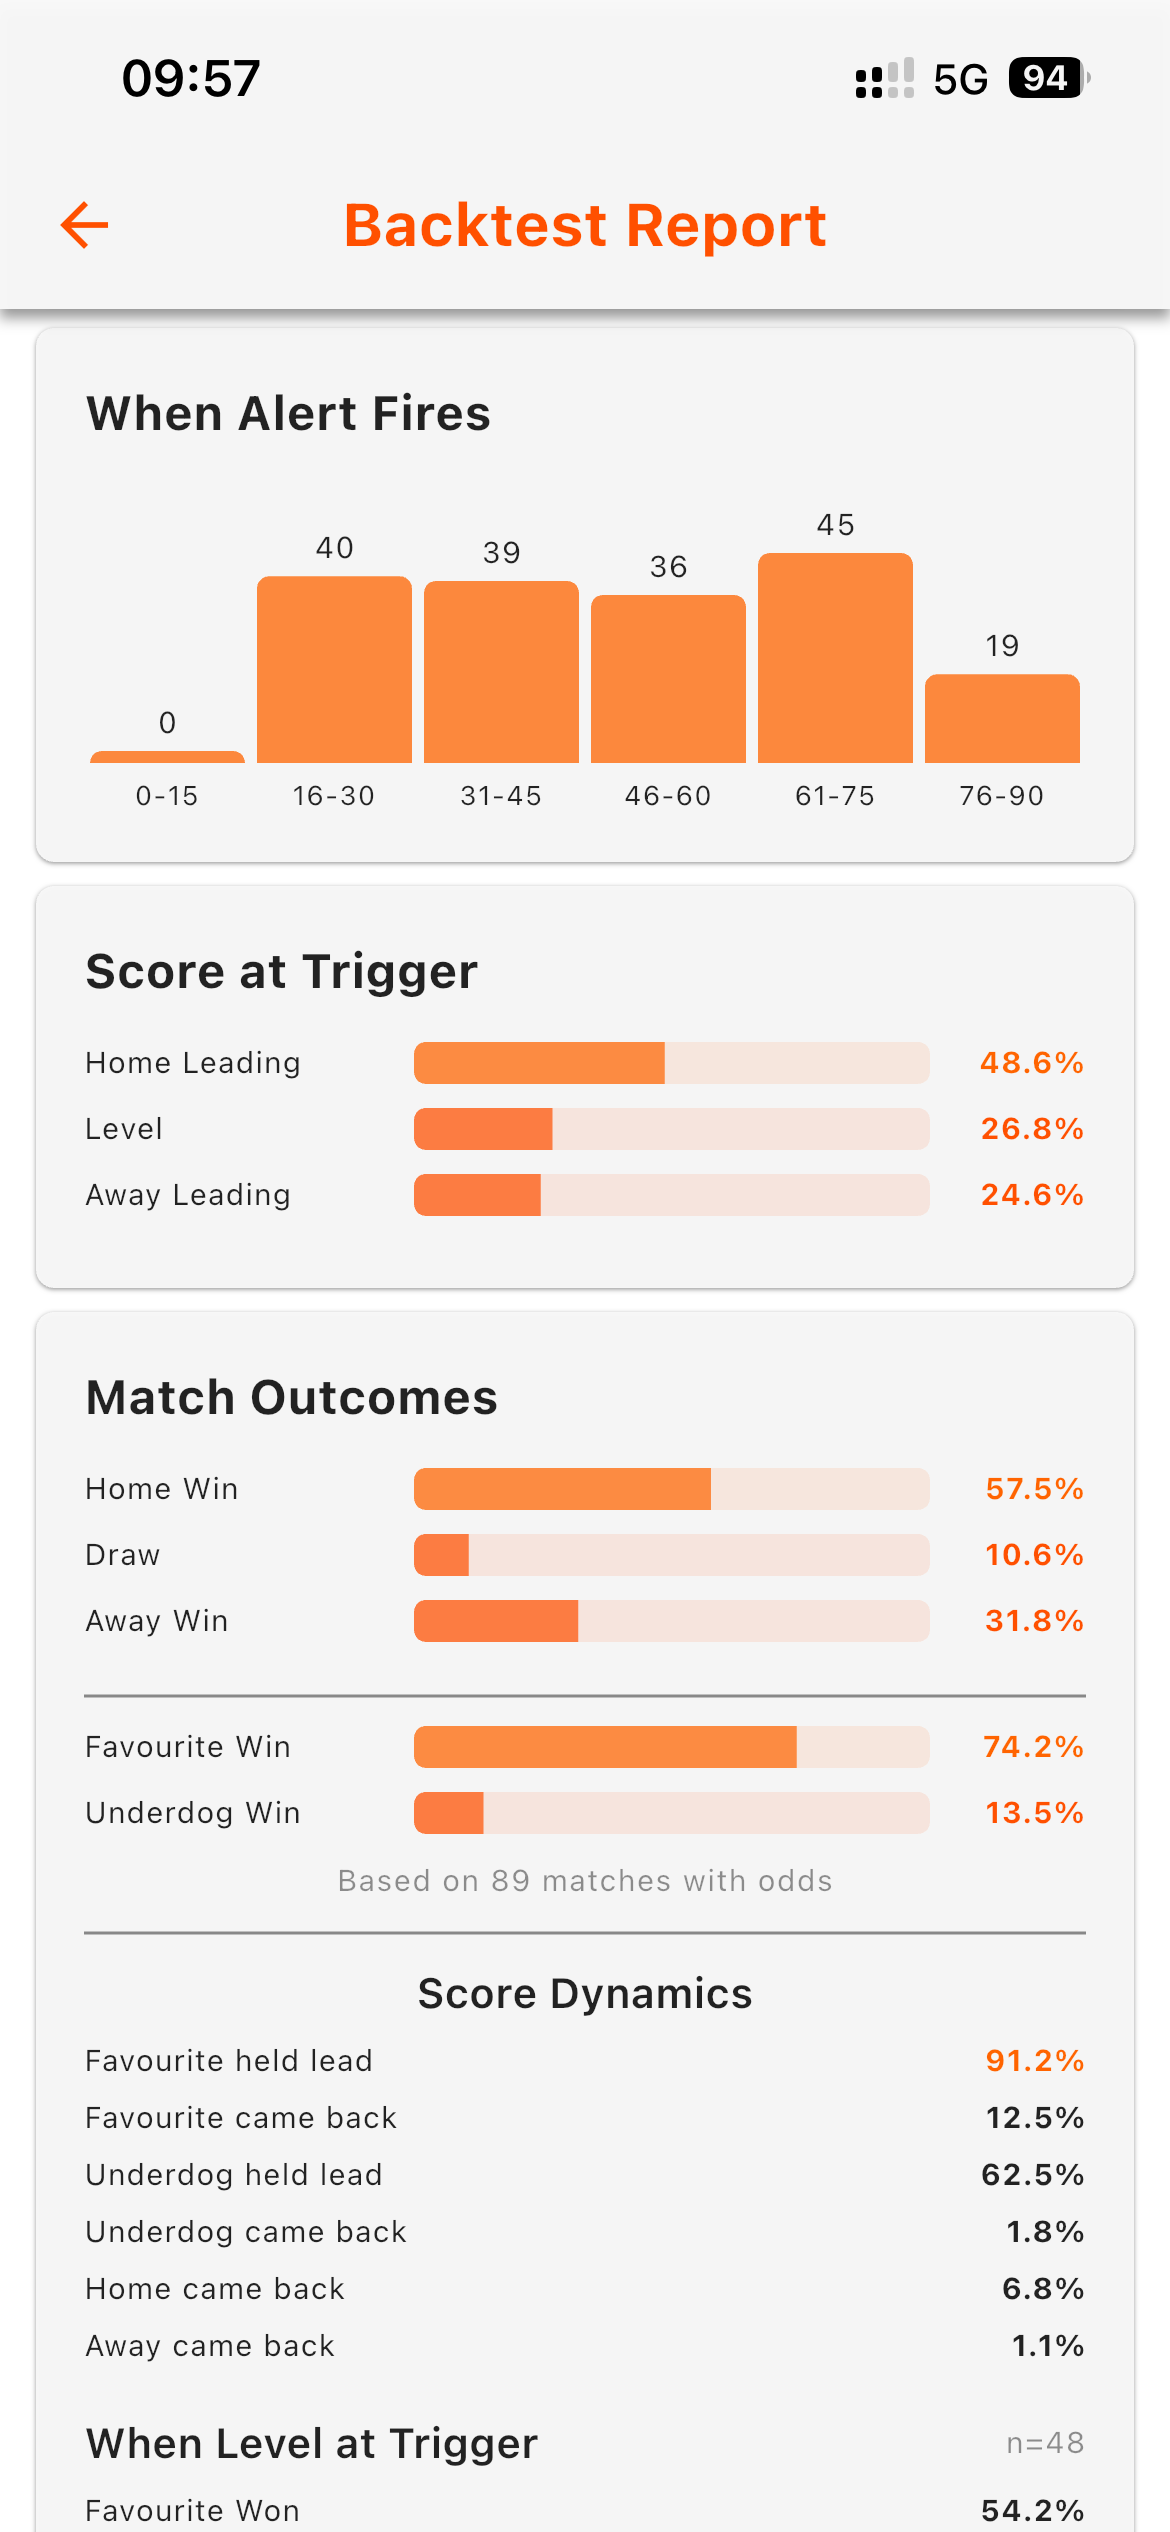
Match Outcomes and Score Dynamics sections show what tended to happen after the alert fired: final result splits, favourite win rates, and how often the scoreline reversed.
The post-trigger sections cover match outcomes and goal activity following the moment your alert fired. Match Outcomes shows the final result split (Home Win, Draw, Away Win) along with Favourite Win and Underdog Win percentages where odds data is available. Score Dynamics goes further, showing how often the favourite held their lead, how often the underdog came back, and how often the scoreline reversed entirely. A 91% favourite-held-lead rate in triggered matches is a materially different context from a 50% rate.
Post-trigger goals are broken into time windows: goals within 5, 10, and 15 minutes of the trigger, average goals scored after the alert fires, and over/under percentages for the remainder of the match. A 49% goal-within-15-minutes rate is the kind of number that changes how you read the seven minutes after your alert fires on a live match. The same analysis applies to corners and cards for markets beyond the scoreline.
The Market Analysis section pairs these outcome rates with real odds data where available, showing success rate, average odds, and an expected value figure for markets like Home Win, BTTS, and Over 2.5. This is where you can assess whether a historical edge (say, a 57% home win rate in triggered matches) was available at odds that would make it meaningful over time, or whether the market had already priced it in.
Putting It Together
The most practical use of a backtest is to challenge your assumptions before they cost you. If your alert's trigger rate is much lower than you expected, the conditions may be too restrictive to be useful in practice. If the match outcomes show no discernible pattern (roughly equal home wins, draws, and away wins), the alert may not be identifying a coherent match situation. The by-league and by-country breakdown is worth checking too: some alerts perform differently across competitions, and knowing where an alert has historically been most consistent lets you calibrate how much weight to give it when it fires live.
Backtesting doesn't tell you what will happen. It tells you what has tended to happen, and that's the starting point for analysis that goes beyond instinct.